Excel Project Status Report Template (Free .xlsx + Formulas)
Free Excel project status report template (.xlsx) with auto-RAG formulas and a % complete rollup — plus why 88% of spreadsheets carry errors and how to fix it.
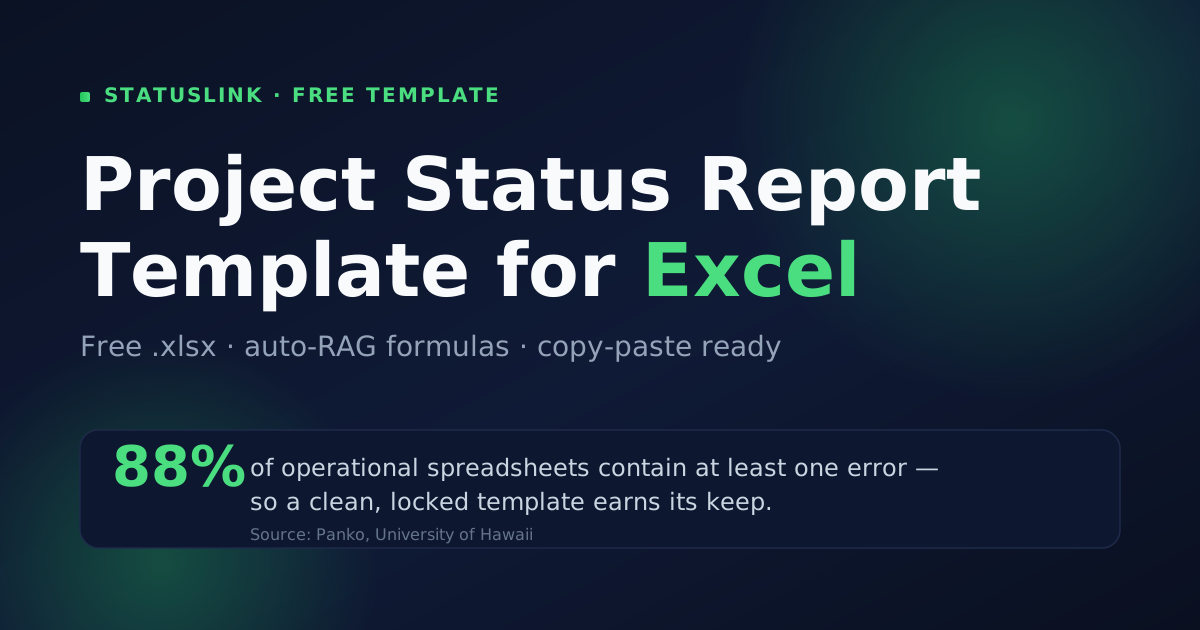
A spreadsheet is the right tool for tracking a project — right up until it quietly tells you the wrong thing. About 88% of operational spreadsheets contain at least one error (Panko, University of Hawaii), and a fast, copy-pasted status sheet is exactly where a stray formula slips through. This guide hands you a free Excel project status report template — a real .xlsx plus a copy-paste grid — shows you the one thing Excel does that Word can't, and is honest about when a spreadsheet stops being worth the upkeep.
Key takeaways
- A solid Excel status report has six blocks: overall status, summary, progress, next steps, milestones, and risks.
- Grab the free .xlsx below, or paste the grid into a blank sheet — no email, no form.
- Excel's real edge over Word is live math: an auto-RAG flag and a % complete rollup that update as you type.
- 88% of operational spreadsheets carry at least one error (Panko), so lock your formulas and keep the layout simple.
- A spreadsheet is a snapshot; a synced status page stays current on its own.
What goes in an Excel project status report?
An Excel project status report needs the same six blocks as any status report — overall status, a short summary, progress this period, plans for next, milestones, and risks — but it lays them out as rows you can sort, filter, and total. Lead with a red/amber/green (RAG) status: PMI found highly effective communication raises on-time delivery from 37% to 71% (PMI).
What a spreadsheet adds over a document is structure you can do math on. Each milestone is a row with a due date and a percentage. Each risk is a row with an owner and a next action. Once those are columns, Excel can total them, flag the late ones, and roll a dozen line items up into a single progress number — without you re-reading the whole thing.
Here's what each block does:
- Header — project, who prepared it, the client, the reporting period, the date.
- Overall status — on track (green), at risk (amber), off track (red).
- Summary — two or three sentences a stakeholder can forward as-is.
- Progress this period — what got done since the last report.
- Planned next — what's coming, so nothing lands as a surprise.
- Milestones — one row each: name, owner, due date, % complete, status.
- Risks and blockers — one row each: impact, owner, next action.
An Excel project status report should carry six blocks — overall RAG status, summary, progress, next steps, a milestones table, and a risks table — with milestones and risks as sortable rows. The status flag matters most: PMI found projects with highly effective communication finish on time 71% of the time versus 37% for those with poor communication (PMI).
Free Excel project status report template (download + copy-paste)
You can use this free Excel project status report template two ways: download the ready-made .xlsx, or copy the grid below into a blank sheet and press Ctrl+T to turn each block into a Table. Both are free, with no email wall — and the Table step is what lets the formulas in the next section work.
⬇ Download the Excel template (.xlsx) — three tabs: Status, Milestones, Risks, with the RAG formula already wired in.
Prefer to build it yourself? Paste these blocks into a sheet:
Status (top block)
| Field | Value |
|---|---|
| Project | [Project name] |
| Prepared by | [Your name / company] |
| Client | [Client name] |
| Reporting period | [Start] – [End] |
| Overall status | 🟢 On track / 🟡 At risk / 🔴 Off track |
| Summary | [Two or three sentences] |
Milestones tab
| Milestone | Owner | Due date | % complete | Status |
|---|---|---|---|---|
| [Name] | [Name] | [Date] | 0% | (formula) |
Risks tab
| Risk / issue | Impact | Owner | Next action | Status |
|---|---|---|---|---|
| [Risk] | High / Med / Low | [Name] | [Next step] | Open / Closed |
Want the same six sections as a document instead? The project status report template for Word is copy-paste ready, and the project status report template hub has the Word, Excel, and PowerPoint files in one place.
How do you set up auto-RAG status in Excel with a formula?
You set up auto-RAG status with one IF formula that reads each milestone's due date and returns a colored flag, then a conditional-formatting rule paints the cell. This is the thing a spreadsheet does that a Word table can't: the status recalculates the instant a date or a percentage changes, so the report is never lying about where a milestone stands.
Drop this in the Status column of the Milestones table:
=IF([@[% complete]]>=1, "🟢 Done",
   IF([@[Due date]]<TODAY(), "🔴 Late",
      IF([@[Due date]]-TODAY()<=3, "🟡 Due soon", "🟢 On track")))
Then add a single rollup so the header's overall status reflects reality:
% complete (project)  =AVERAGE(Milestones[% complete])
Milestones late        =COUNTIF(Milestones[Status], "🔴 Late")
The trap here is doing too much. A status tracker is not a project plan — the moment you wire in task dependencies, baselines, and a Gantt, you've built the exact kind of overgrown sheet where most of those 88% of errors live. Keep the formulas to two jobs: flag the late rows, and total the progress. Everything else is a column you'll forget to update.
Set up auto-RAG status in Excel with a nested IF on the due date plus a conditional-formatting rule, and the flags maintain themselves. That live recalculation is the main reason to track status in a spreadsheet rather than a document — but it only stays trustworthy if you keep the formula simple, since 88% of operational spreadsheets carry at least one error (Panko).
Excel vs Word vs a live status page
Use Excel when you're tracking many line items and want live totals, Word when a client wants a clean one-page document to forward, and a synced status page when you just need them to see current status without you rebuilding anything. The 45% of project managers who lose more than a full day each week to reporting feel the cost of the first two most (Wrike, via Forbes).
My own Excel tracker is where this got real. By the third month it had five near-identical copies — tracker_final, tracker_final_v2, tracker_USE-THIS — and I once sent a client the one with last sprint's numbers. The math was fine. The version was wrong. That's the failure mode nobody warns you about: the spreadsheet is only as current as the last time you remembered to open the right file.
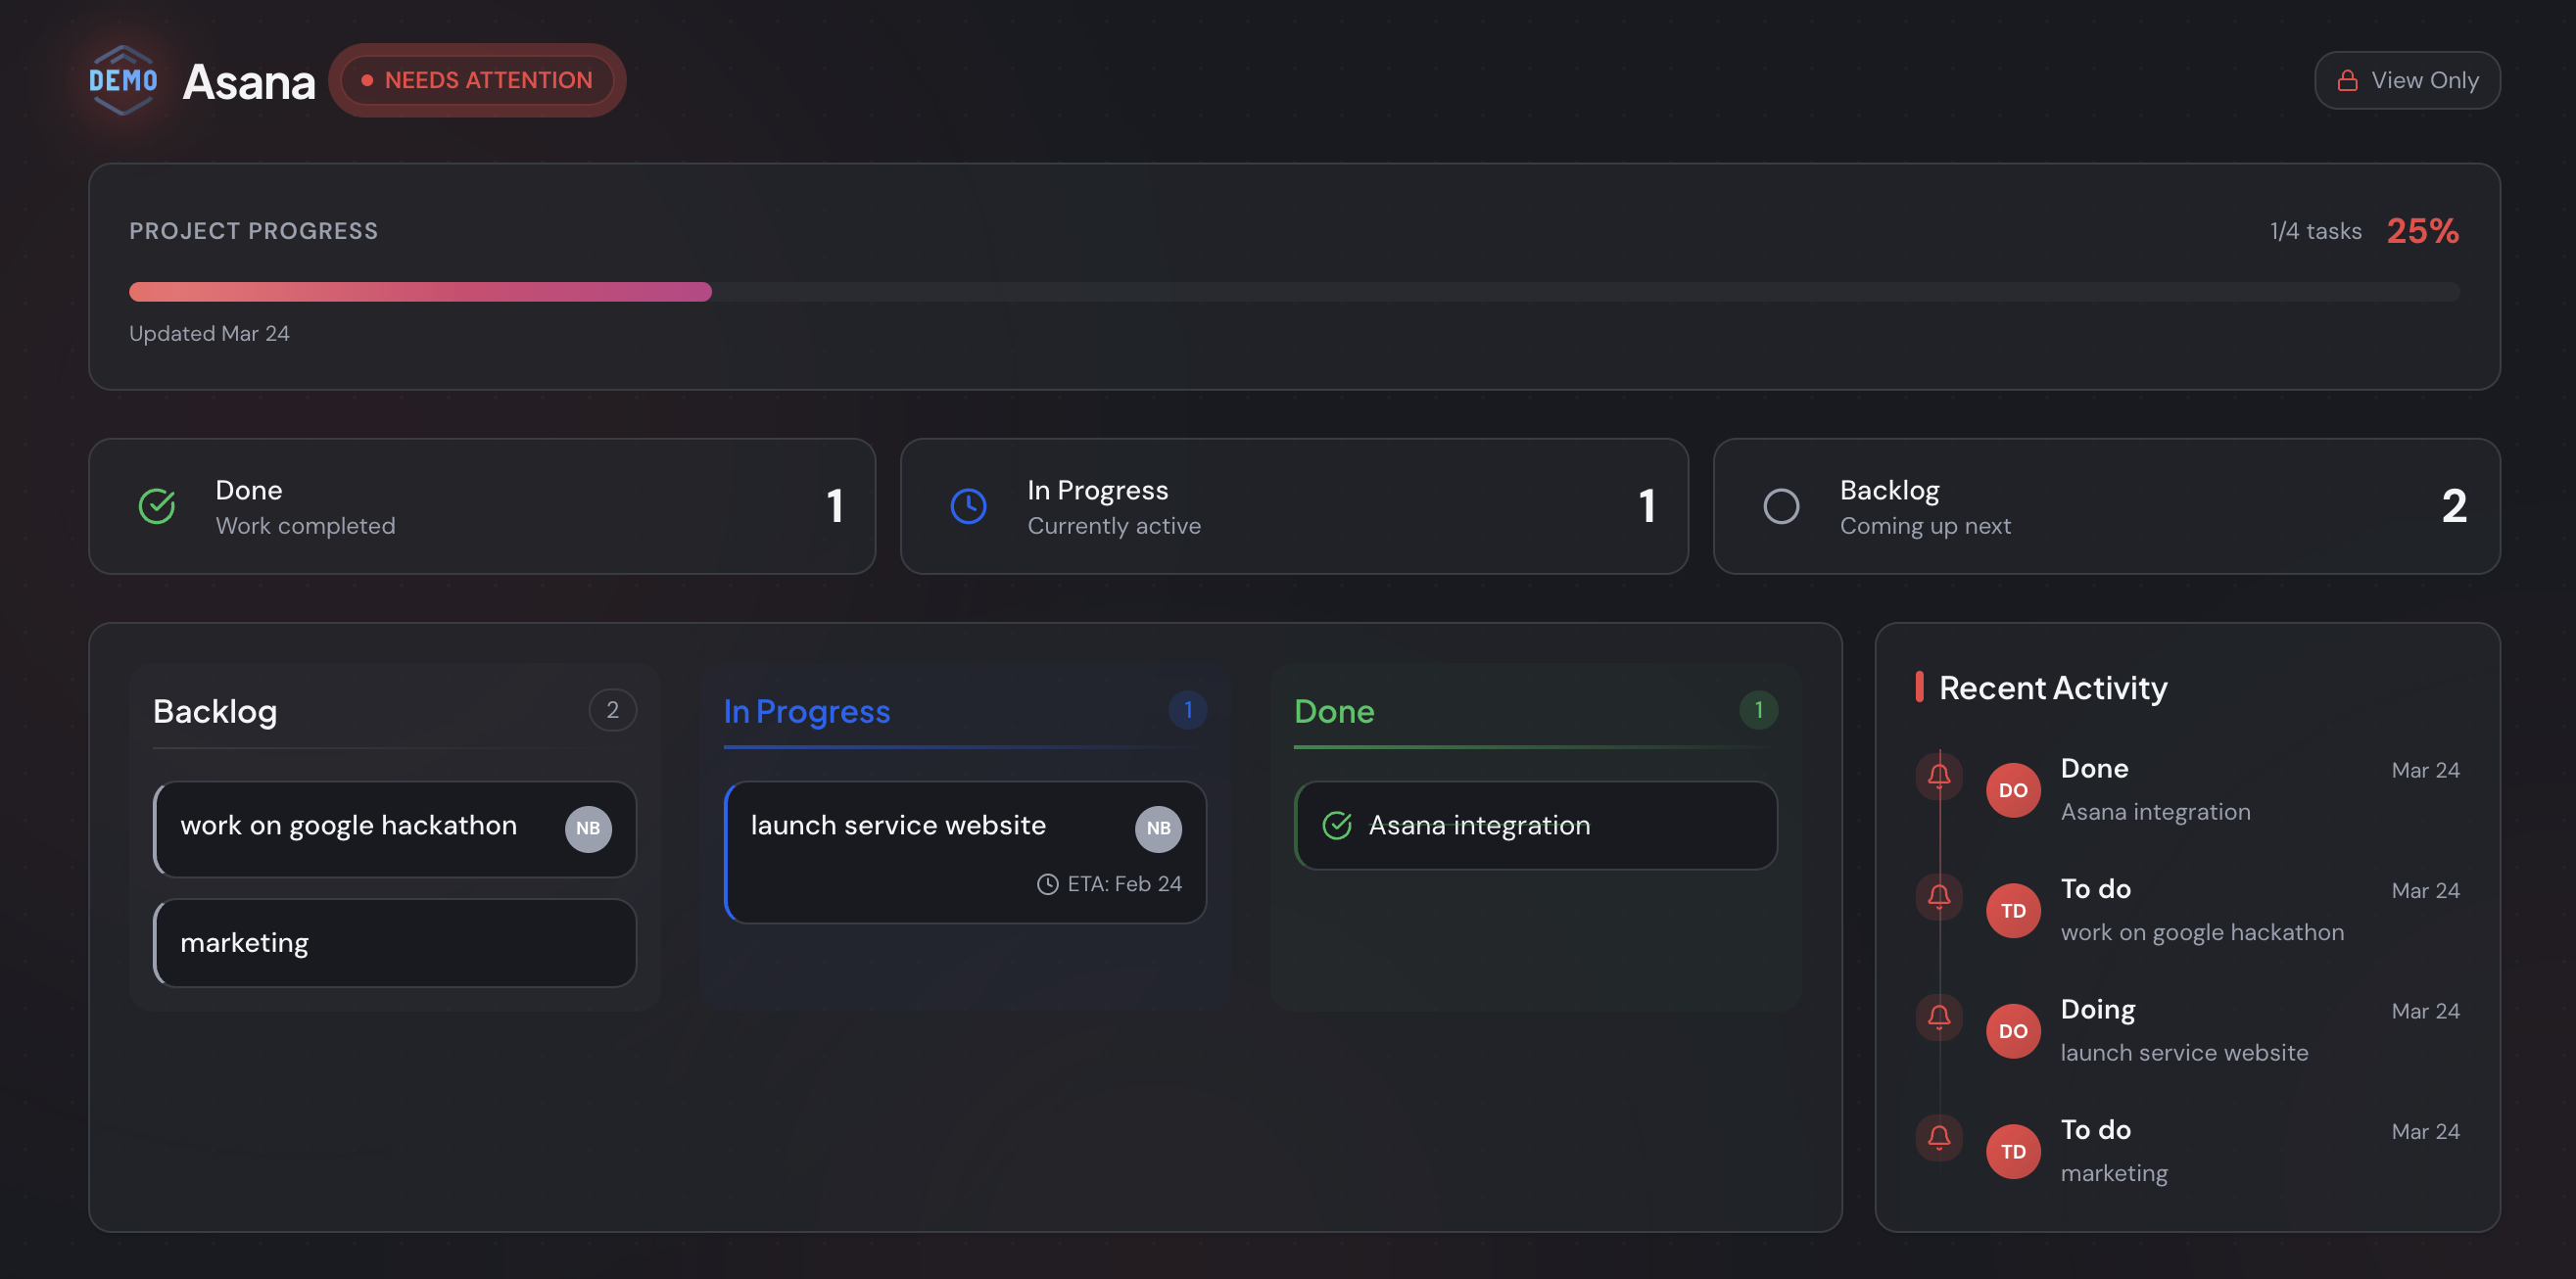
Excel wins for sortable trackers and live totals; Word wins for a forwardable one-pager; a synced page wins for the recurring "is this on track?" check. For a faster cadence, the weekly project status report template trims the structure, and if clients mainly need to see status, a no-login client portal compares the options.
What's the catch with an Excel status report?
The catch is twofold: spreadsheets break quietly, and they go stale fast. Around 88% of operational spreadsheets contain at least one error (Panko, University of Hawaii), and even a flawless one is out of date the moment your board moves on. Rebuilding it each cycle is the busywork that eats 3-4 hours a week and could be automated to save roughly 13.5 hours per project manager monthly (McKinsey, via PPM Express).
There's a lighter way to answer "where are we?" than maintaining a file. Connect the board you already run — Trello, Jira, or Asana — and StatusLink turns it into a branded, read-only status page your client opens with one link. No login for them, no rebuild for you, and no second copy to fall out of date. It refreshes when you move a card.
The catch with an Excel status report is that it can be wrong without looking wrong — 88% of operational spreadsheets carry an error (Panko) — and it's stale the moment your board moves on. A status page synced from Trello, Jira, or Asana stays current on its own, which is why automated reporting saves around 13.5 hours per project manager each month (McKinsey).
Use the Excel template when you need a sortable tracker or live totals, and the Word version when a client wants a document to forward. For the weekly "is this on track?" question, though, a synced page beats a sheet that's wrong by morning. You can start free and connect Trello, Jira, or Asana and send a live status page in a few minutes — or browse all the report templates if a file is exactly what this client needs.
Frequently asked questions
Is the Excel project status report template free?
Yes. Download the ready-made .xlsx or paste the grid below into a blank sheet — there's no email wall and no form. Keep the layout simple once you have it: roughly 88% of operational spreadsheets contain at least one error (Panko, University of Hawaii), and most of those creep in when a clean template gets overgrown.
What should an Excel project status report include?
Six blocks: an overall RAG status, a short summary, progress this period, plans for next period, a milestones table, and a risks table. Lead with the status indicator — PMI found highly effective communication lifts on-time delivery from 37% to 71%, so the colored flag at the top does most of the work.
How do I show RAG status automatically in Excel?
Use one IF formula that reads each milestone's due date and returns a red, amber, or green flag, then a conditional-formatting rule to color the cell. Unlike a Word table, the status recalculates the moment a date or a percentage changes — that live math is the main reason to track status in a spreadsheet.
Is Excel or Word better for a project status report?
Excel suits trackers with many line items and live totals; Word suits a clean one-page document a client wants to forward. Neither stays current on its own. With 45% of project managers already losing more than a day a week to reporting (Wrike, via Forbes), the upkeep is the real cost of both.
Can I automate an Excel project status report?
Yes. Instead of rebuilding a sheet each week, sync the Trello, Jira, or Asana board you already run to a tool like StatusLink, which turns it into a branded, read-only status page clients open with one link. Automated reporting saves around 13.5 hours per project manager monthly (McKinsey).